 Mall Metrics
Portfolio & tenants
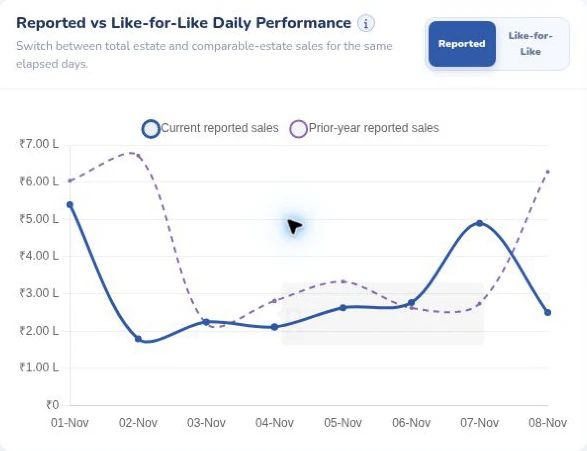
Reported versus like-for-like daily performance
The chart is shown in Reported mode. Compare current and prior-year net sales, then switch to like-for-like in the product to examine the comparable estate.
A new anchor store can lift mall turnover in the same month that existing retailers lose business. Both facts matter at a leasing review. Reported growth answers how much sales changed across the property. Like-for-like growth answers how much sales changed for a defined group of comparable stores. Give the two measures separate labels and show the stores behind the comparable group.
The chart is shown in Reported mode. Compare current and prior-year net sales, then switch to like-for-like in the product to examine the comparable estate.
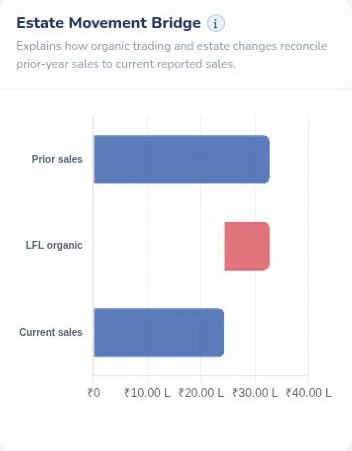
Read how the verified like-for-like movement connects prior-period sales to the current total in the demo’s estate bridge.
Choose equivalent trading periods and a cut-off. If this month has eight complete days, start with the same eight elapsed days of the comparison period. For a weekend-led category, inspect the day-of-week mix as well. Then agree the conditions for inclusion. Did the store trade in both periods? Was its area materially different? Was it closed for refurbishment, reporting only partial sales, or trading under a different tenant?
Document how the mall treats relocations and changes of format. A small kiosk that becomes a full-size store can keep the same brand name while changing the commercial basis of comparison. Apply the policy consistently and show the value excluded by each reason.
Consider an illustrative month at a Singapore shopping centre. Comparable tenants sold S$1.20 million a year ago and S$1.26 million this year. A departing tenant added S$80,000 in the earlier period. A new opening added S$160,000 this year. The reported totals are S$1.28 million and S$1.42 million, which gives reported growth of 10.9%. Comparable growth is S$60,000 divided by S$1.20 million, or 5%.
The S$140,000 increase bridges cleanly. Continuing stores contributed S$60,000, the new opening added S$160,000, and the departing tenant removed S$80,000. The landlord can now ask two focused questions. Which categories produced the S$60,000 increase, and how much of the new store’s first month reflects opening-week demand?
A mall reporting only part of the period needs a visible cut-off. In the Mall Metrics demo portfolio, the group overview displayed a common evidence-through date and identified malls excluded for missing current-period sales. The portfolio measure was labelled reported same-period growth. The deeper mall view offered an estate movement bridge and tenant comparability evidence. That distinction is especially important for an operator managing several properties with different opening histories.
For a portfolio like-for-like figure, sum current and prior sales for the agreed eligible stores in a common reporting currency, then calculate growth on those totals. If assets trade in different currencies, state whether both periods use constant rates or each period’s actual exchange rates. A simple average of mall growth percentages gives a small centre the same influence as a large one. State which method management is reading.
Explore portfolio analytics · Read how to compare trading density
See how tenant submissions become a finance review and a management brief.