 Mall Metrics
Portfolio & tenants
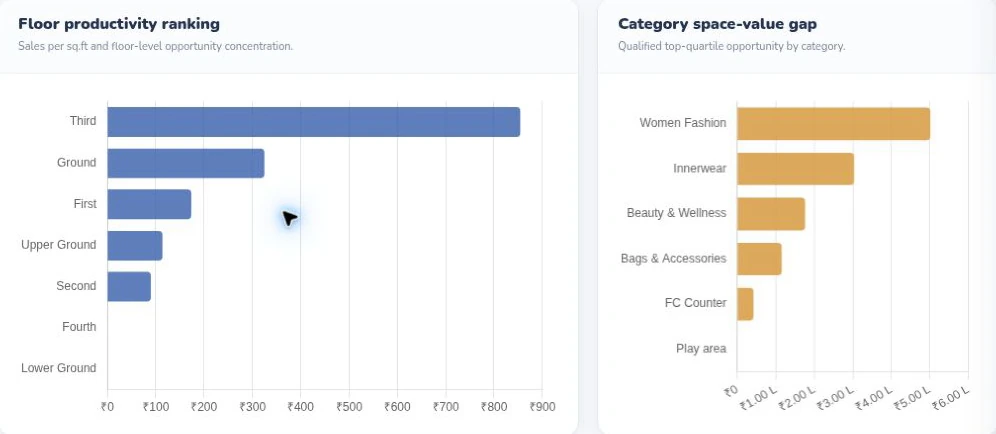
Floor productivity and category space value
Read rupees per square foot by floor next to each category’s estimated gap to its top-quartile benchmark. The two charts use different units.



 Mohali Walk
 Bhutani City Center 32
 DSL Virtue Mall
 GSM Mall
 Omaxe Connaught Place
 Omaxe Chandigarh
 Mall De Goa
 KW Delhi 6 Mall
 Central 50
 Gulshan One29
 Florett Mall
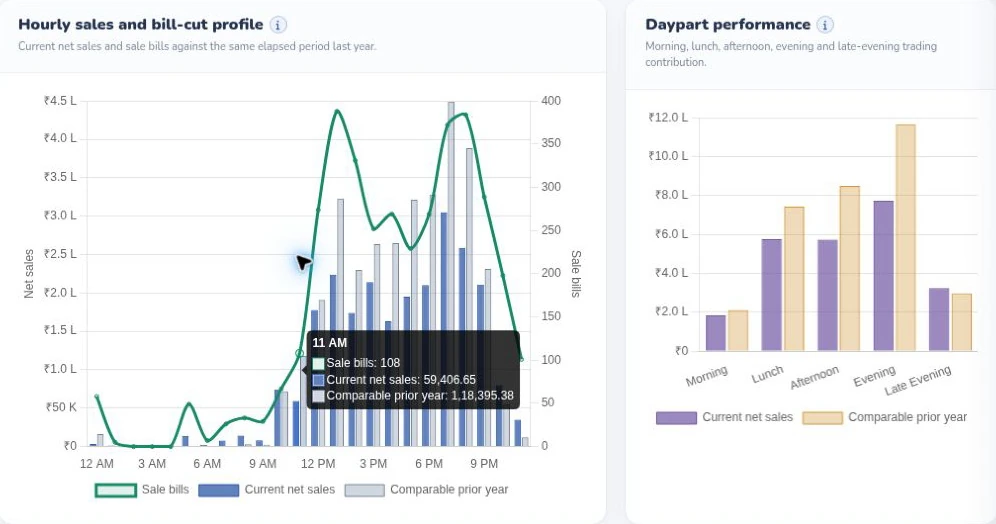
Compare the hourly sales curve and bill count with the prior year, then see how morning, lunch, afternoon, evening and late-evening trading contribute to sales.
Explore related reportsRead rupees per square foot by floor next to each category’s estimated gap to its top-quartile benchmark. The two charts use different units.
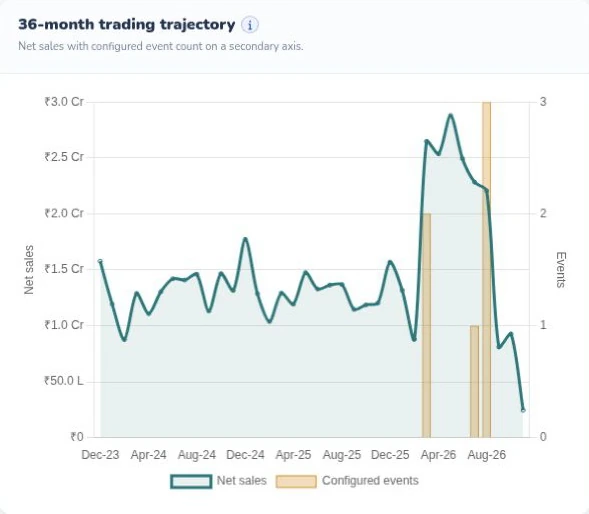
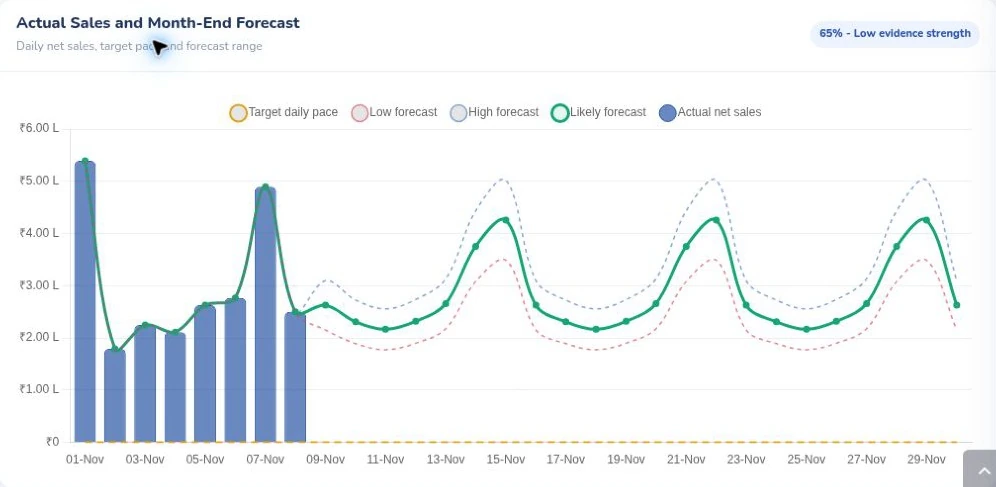
Trace net sales over a longer history and compare shifts against the configured event markers. The series is shown on the report’s crore-rupee scale.
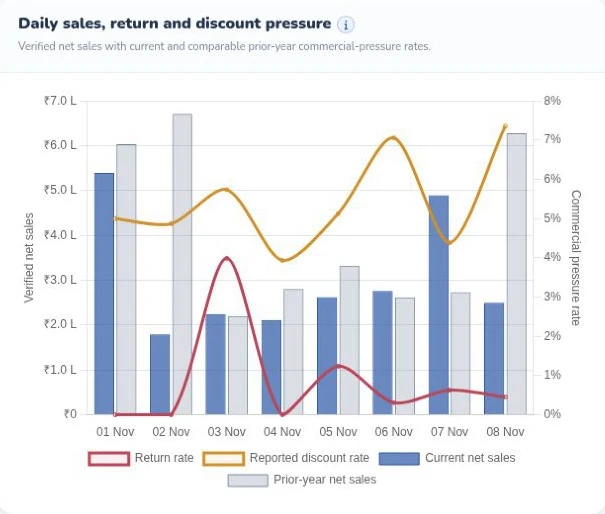
Read current and prior-year sales bars alongside the return-rate and reported discount-rate lines. Sales value and pressure rates have separate axes.
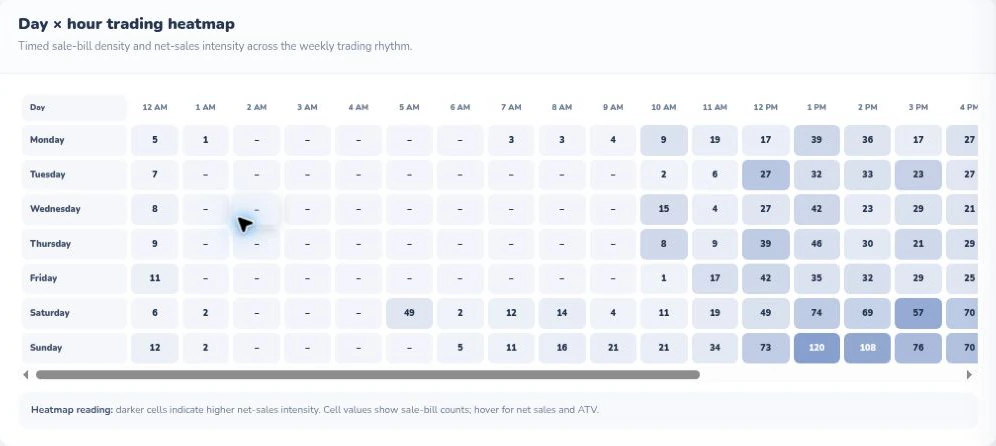
Read down for the weekday and across for the hour. Darker cells identify busier trading windows. This capture shows the visible portion of the horizontally scrolling report.
A late file can make a healthy store look weak. An unrecorded return can change the sales base for rent. Mall Metrics shows each team what sits behind the total.
Explore the benefitsSee which tenants owe a submission and which recorded zero sales. Give tenant relations a list they can act on before the meeting.
See missing sales daysCompare POS, declared and certified sales for the same tenant and period. Identify the source pair to investigate before reviewing rent.
See sales reconciliationCompare sales per square foot or metre against relevant peers. Take category, trading days and occupied area into the renewal conversation.
See tenant performanceStart with a question a centre manager would ask. Explore the reporting gaps, store comparisons and source differences behind a trading-day brief.
AI in the ADSR platformAt the 10:00 cut-off, 116 of 120 expected stores had submitted. Three of the 116 confirmed zero sales. Tenant relations can follow up with the four outstanding stores.
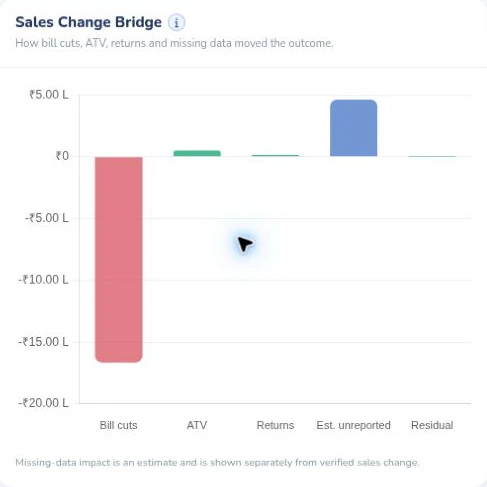
The 116 reporting stores traded $511,000, up from $500,000 for those same stores in the comparison period. The prior total for all 120 was $525,000. Including the four absent stores in the prior base makes growth appear negative.
One tenant’s monthly POS total is $310,000. Its daily declarations and its certified statement both total $307,600. Finance can start with POS adjustments and returns for that period. The figures alone do not identify the cause.
See the missing date and number of outstanding days for each store. A tenant reporting zero appears in a separate report.
Explore this report Product screen · Demo workspace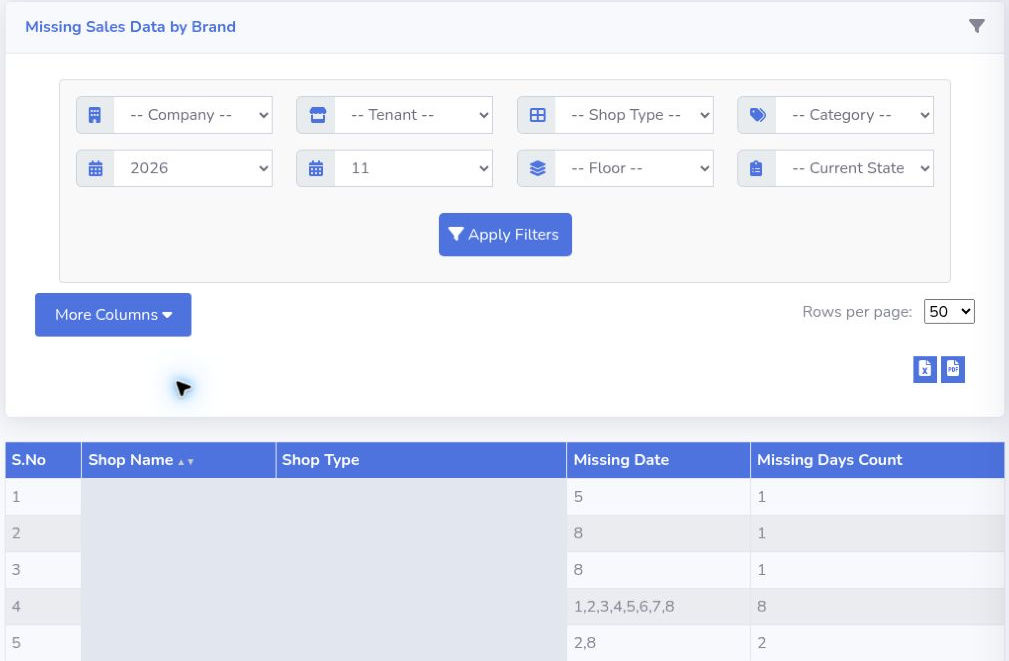
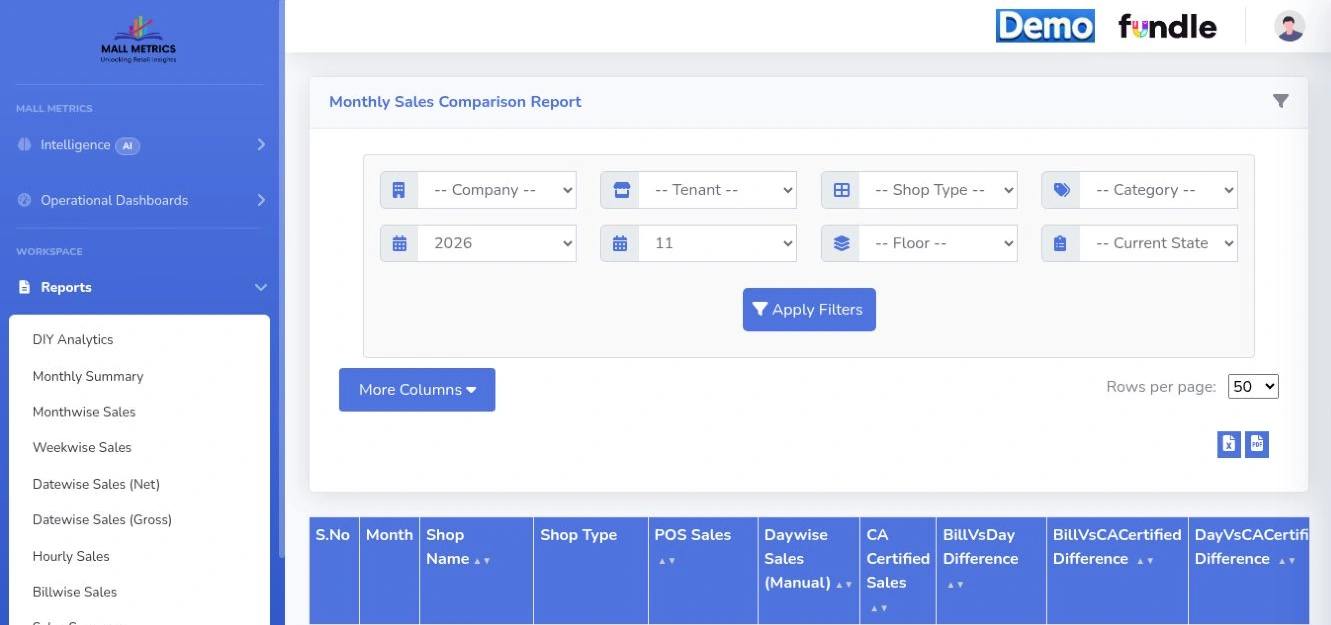
Pair each POS, daily and certified total for the same month. Finance can trace a difference back to the two sources that created it.
Explore this report Product screen · Demo workspace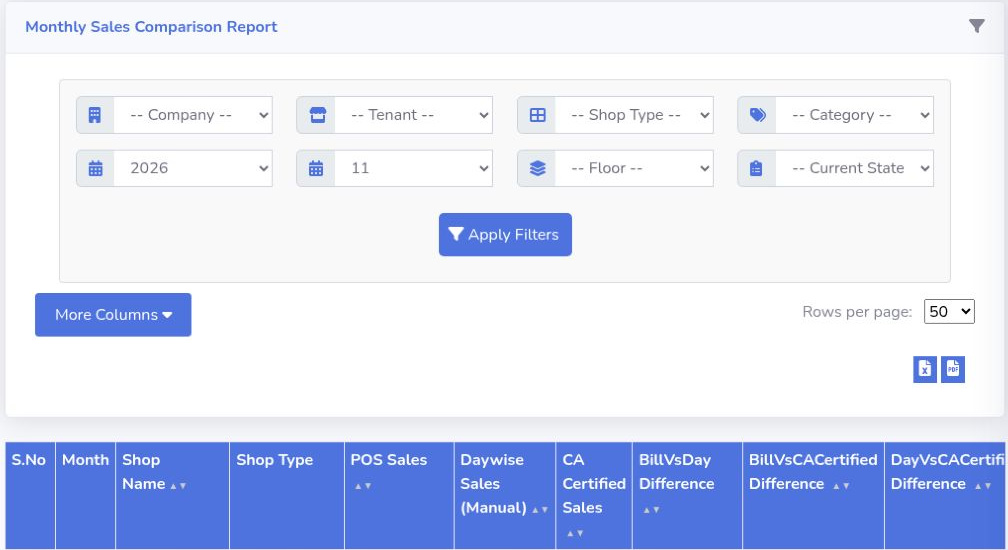
Choose the properties and measures to compare, then check the common evidence date before reading the ranking.
Explore this report Product screen · Demo workspace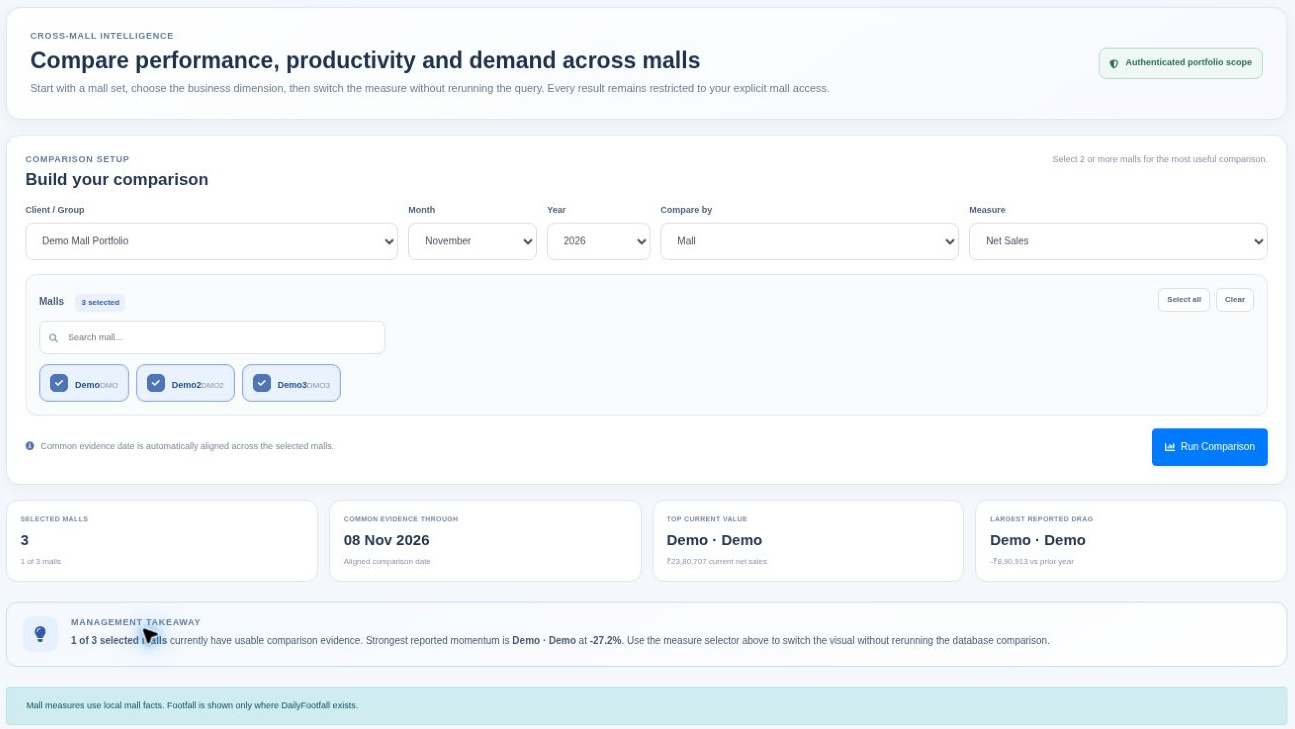
Eight POS families have tenant mappings in the demo. The directory also identifies systems to qualify for your property.
Explore the POS directorySee how tenant submissions become a finance review and a management brief.