 Mall Metrics
Management dashboards
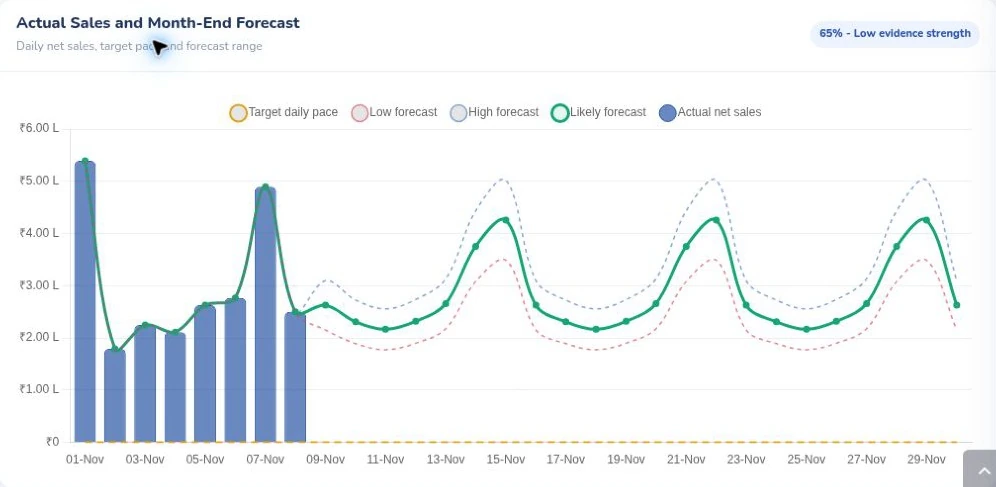
Actual sales and month-end forecast
The bars show reported daily net sales through 8 November. The lines extend the likely, low and high daily forecasts to month-end. The evidence rating travels with the projection.
Explore 29 captures from the Mall Metrics demo. Open a screen to inspect its charts, reporting period and underlying measures.
29 screens
The bars show reported daily net sales through 8 November. The lines extend the likely, low and high daily forecasts to month-end. The evidence rating travels with the projection.
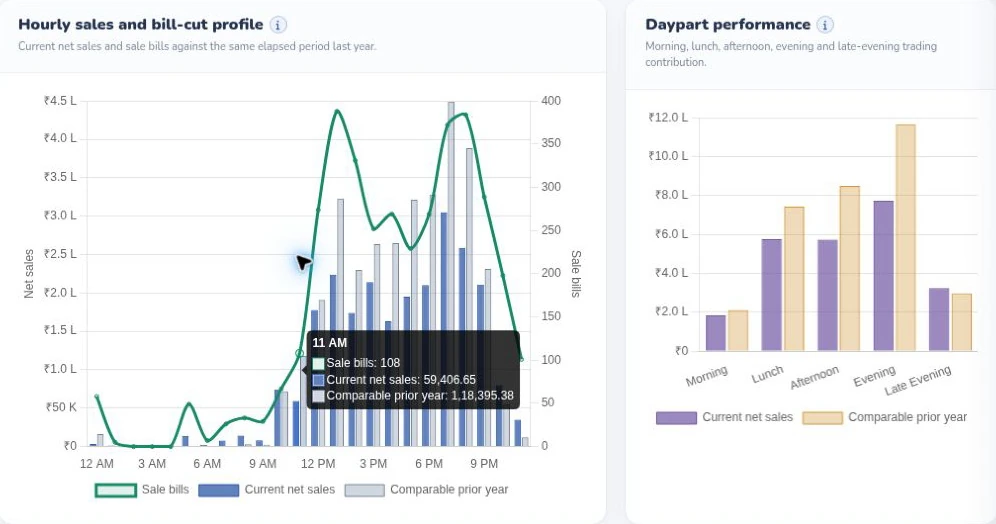
Compare the hourly sales curve and bill count with the prior year, then see how morning, lunch, afternoon, evening and late-evening trading contribute to sales.
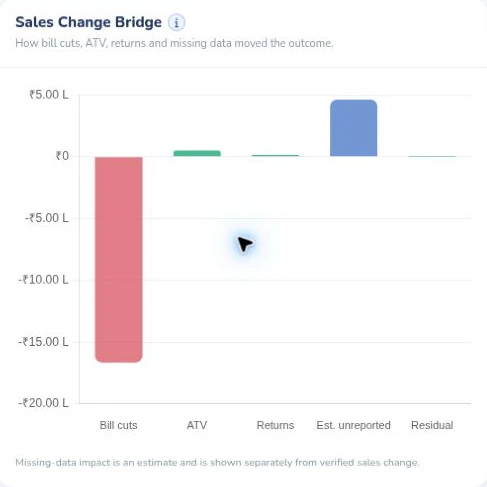
Trace the change in trading through bill count, average transaction value, returns, estimated unreported sales and the residual. The missing-data contribution is an estimate.
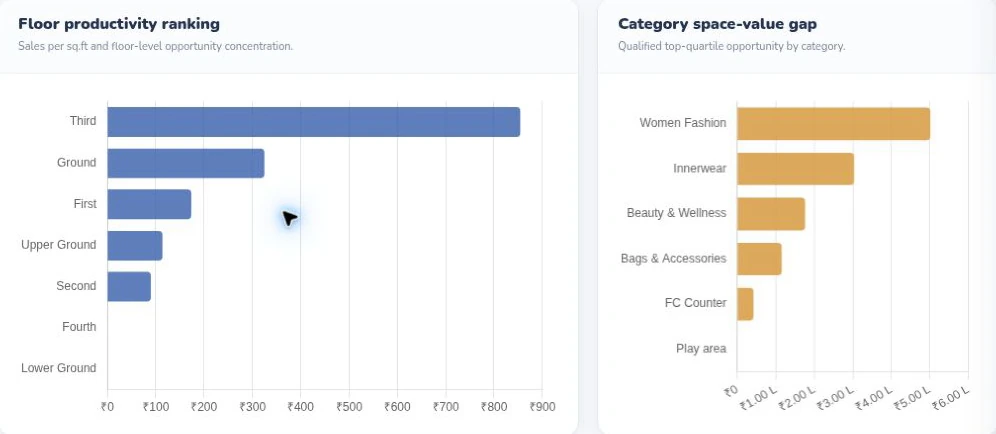
Read rupees per square foot by floor next to each category’s estimated gap to its top-quartile benchmark. The two charts use different units.
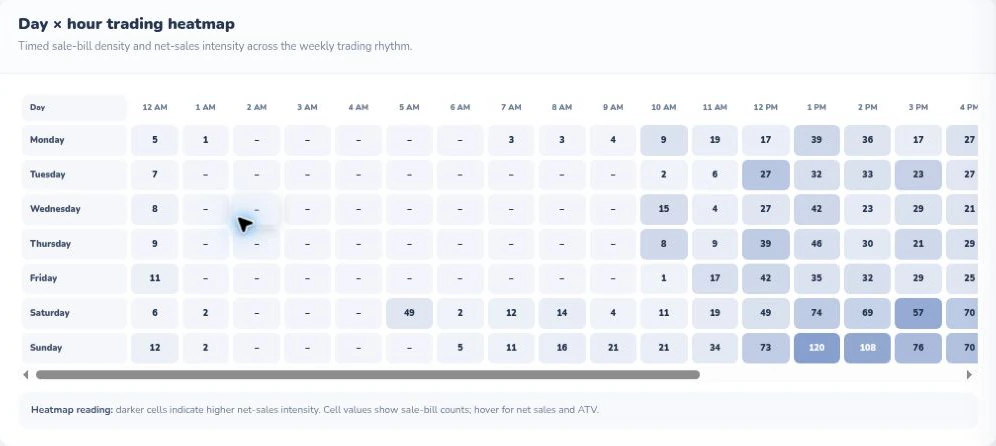
Read down for the weekday and across for the hour. Darker cells identify busier trading windows. This capture shows the visible portion of the horizontally scrolling report.
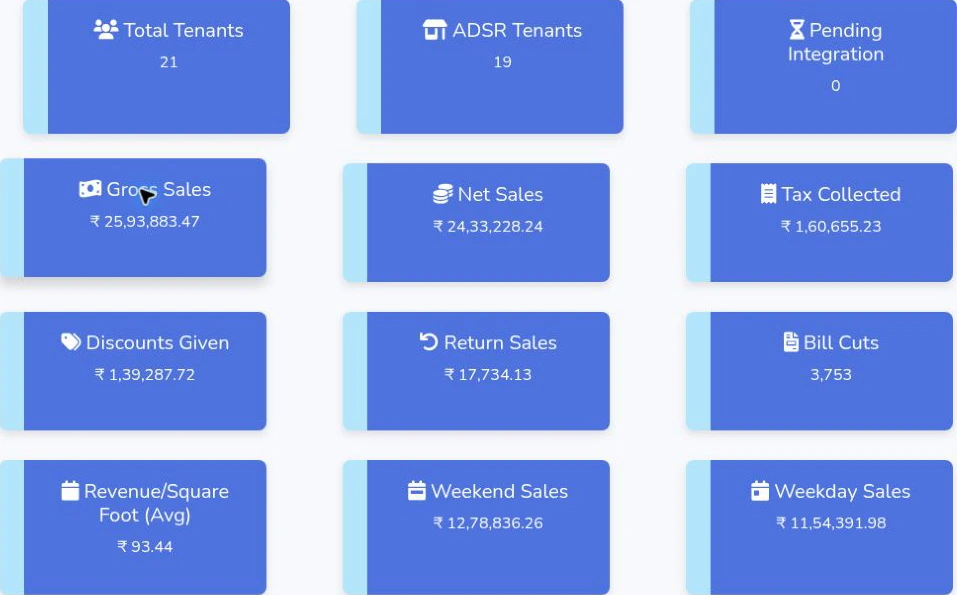
Read twelve operating measures together, including tenant coverage, gross and net sales, tax, returns, bills and the weekday–weekend split.
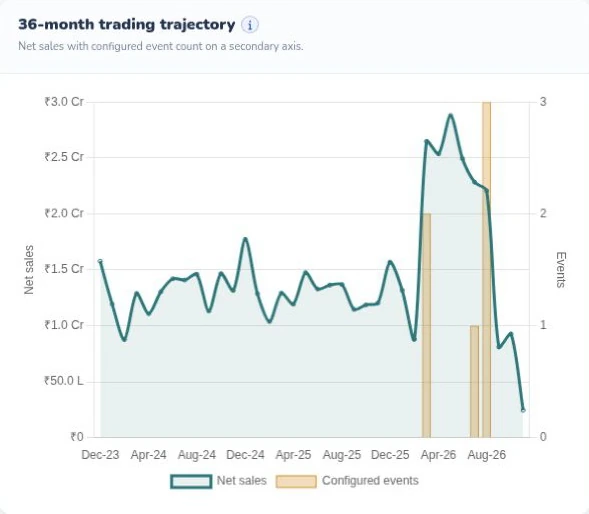
Trace net sales over a longer history and compare shifts against the configured event markers. The series is shown on the report’s crore-rupee scale.
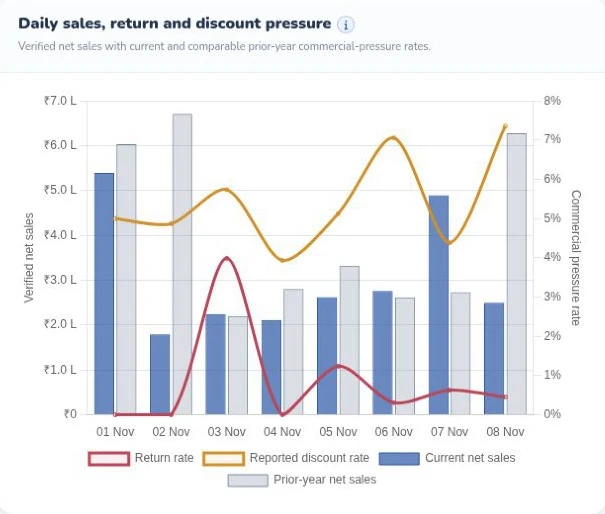
Read current and prior-year sales bars alongside the return-rate and reported discount-rate lines. Sales value and pressure rates have separate axes.
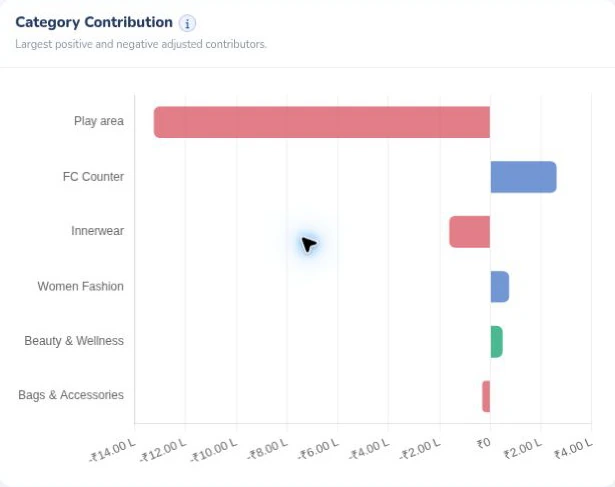
See which categories contributed positively or negatively to the adjusted change. The bars show signed contributions so a drag remains visible beside a gain.
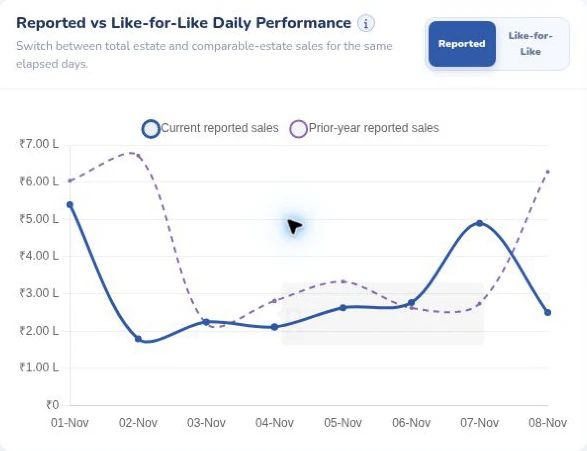
The chart is shown in Reported mode. Compare current and prior-year net sales, then switch to like-for-like in the product to examine the comparable estate.
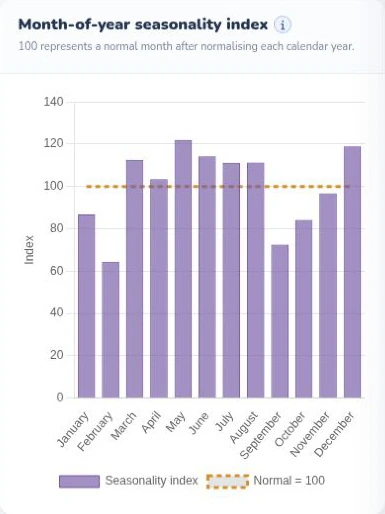
Compare each calendar month with the average month. The dotted line at 100 marks the baseline and makes seasonal peaks and troughs easier to read.
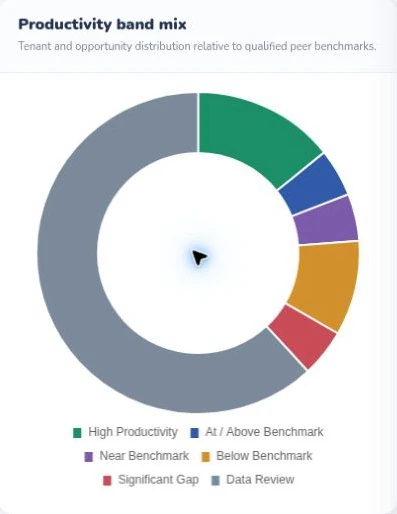
Compare tenant counts across productivity bands, including the data-review group. Use peer-qualified records when assessing a store’s productivity.
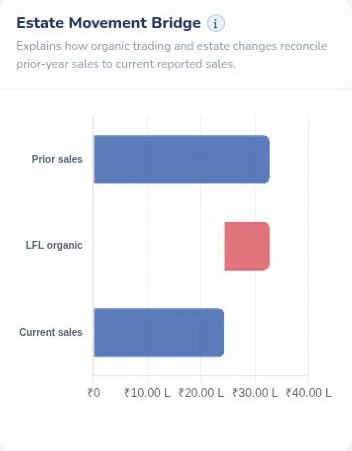
Read how the verified like-for-like movement connects prior-period sales to the current total in the demo’s estate bridge.
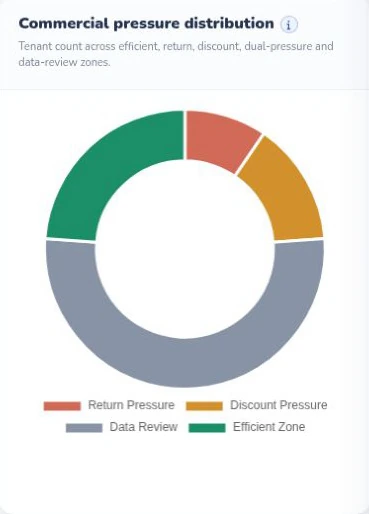
See how the demo distributes commercial signals across return pressure, discount pressure, data review and the efficient zone. Each segment is a starting point for investigation.
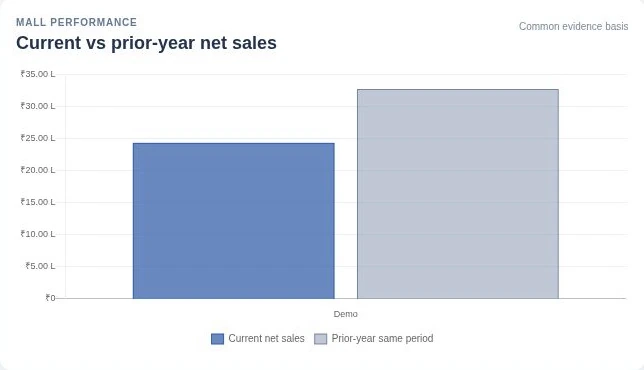
Read current and prior-year net sales for the one demo property with evidence in both periods. The comparison stops at the common evidence date.
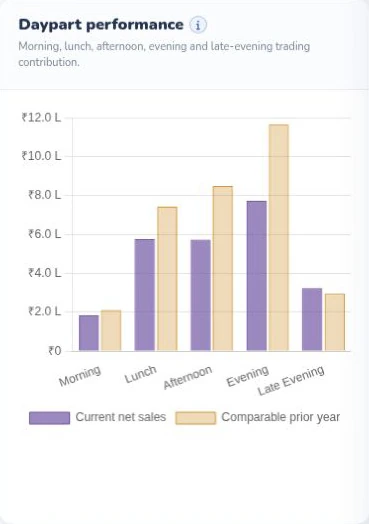
Read the contribution of each daypart to total net sales against the comparable prior year. The evening period is the largest contributor in this selection.
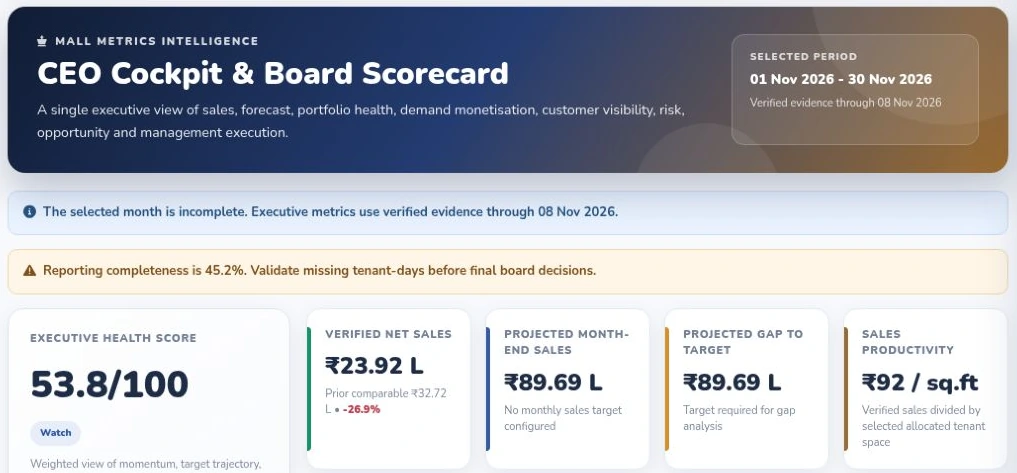
November 2026 demo, evidence through 8 November. The board scorecard shows the executive health score, verified sales, projected close, productivity and reporting coverage. A sales target is unconfigured in this selection.
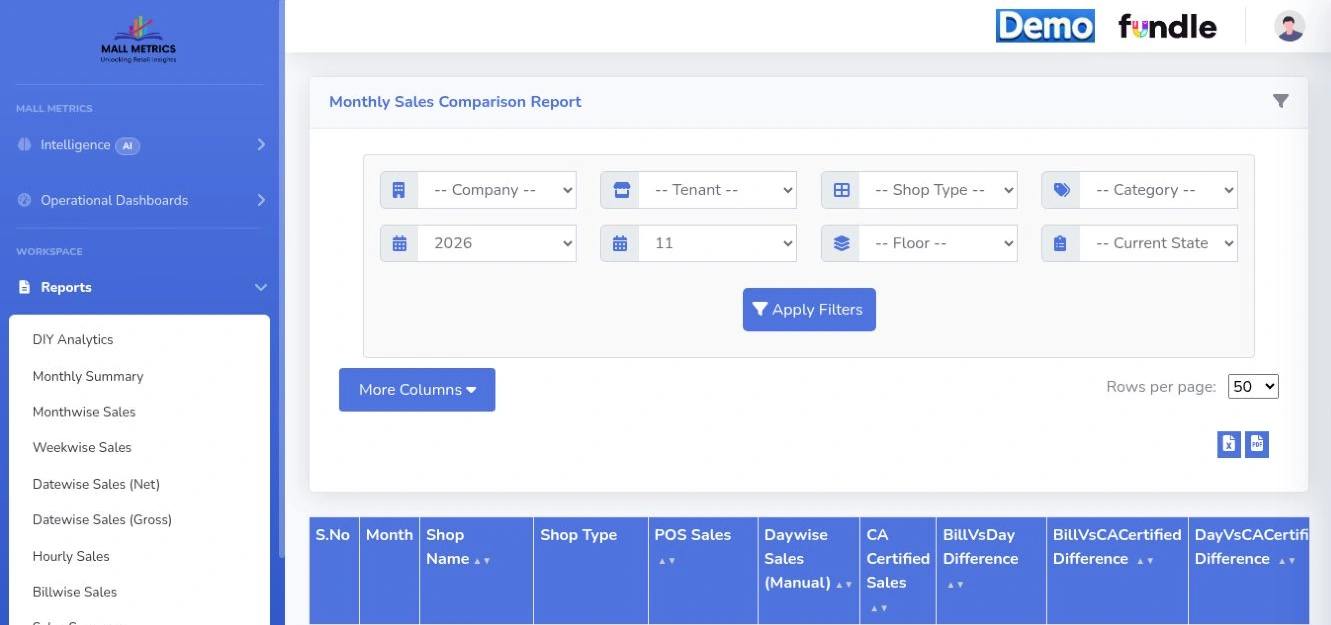
The report menu provides hourly, daily, weekly, gross, net and billwise views. The open November 2026 monthly comparison report exposes POS, manual and certified sales columns and source-pair differences.
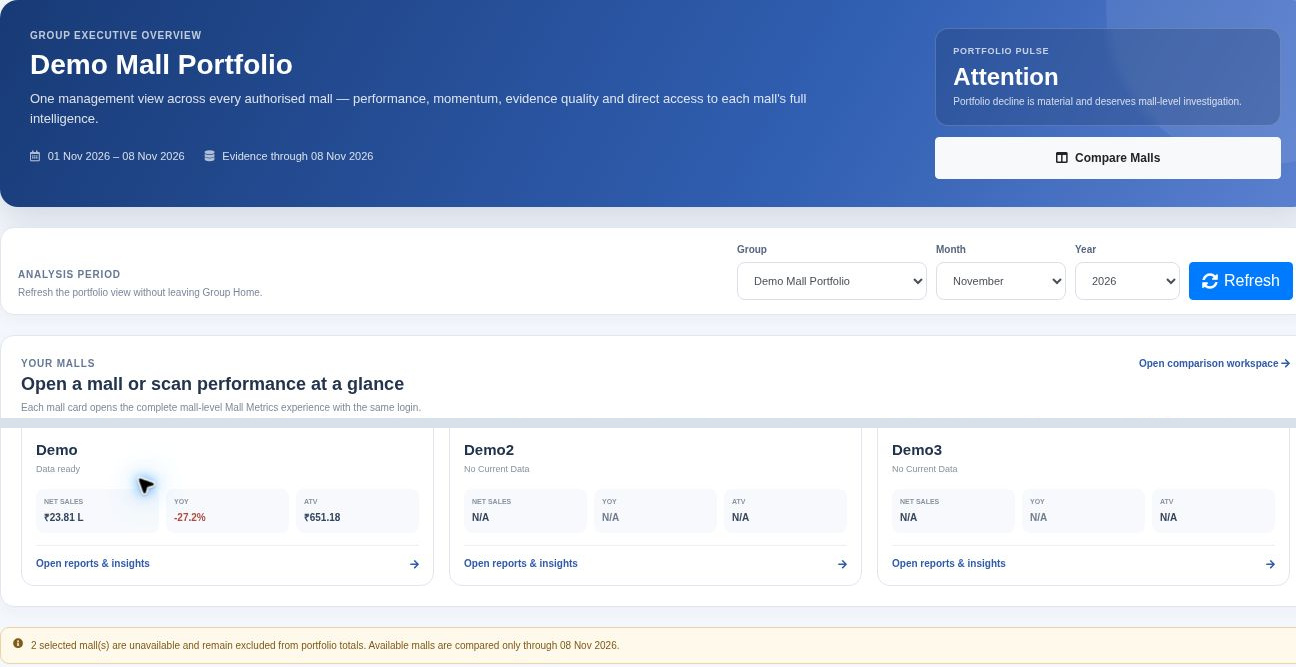
See which properties have current sales data before reading portfolio growth. The demo keeps two unavailable properties visible and excludes them from the aggregate.
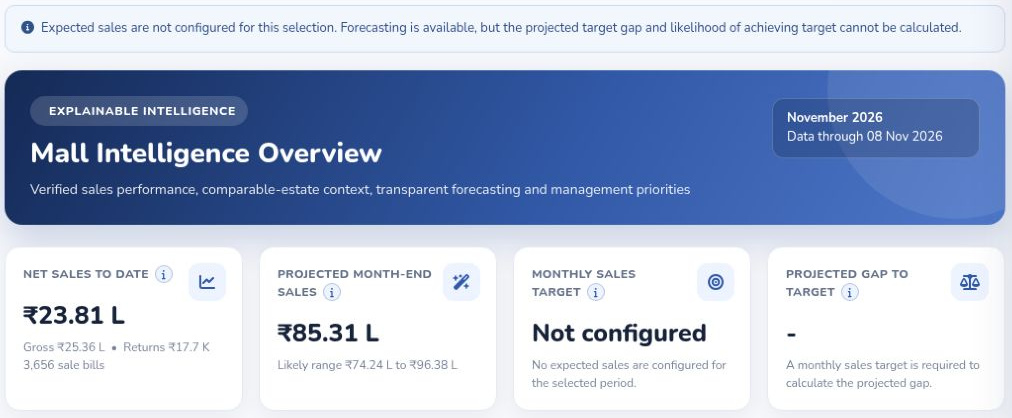
Read net sales through the evidence date alongside a month-end projection and its range. The selected mall has no configured sales target.
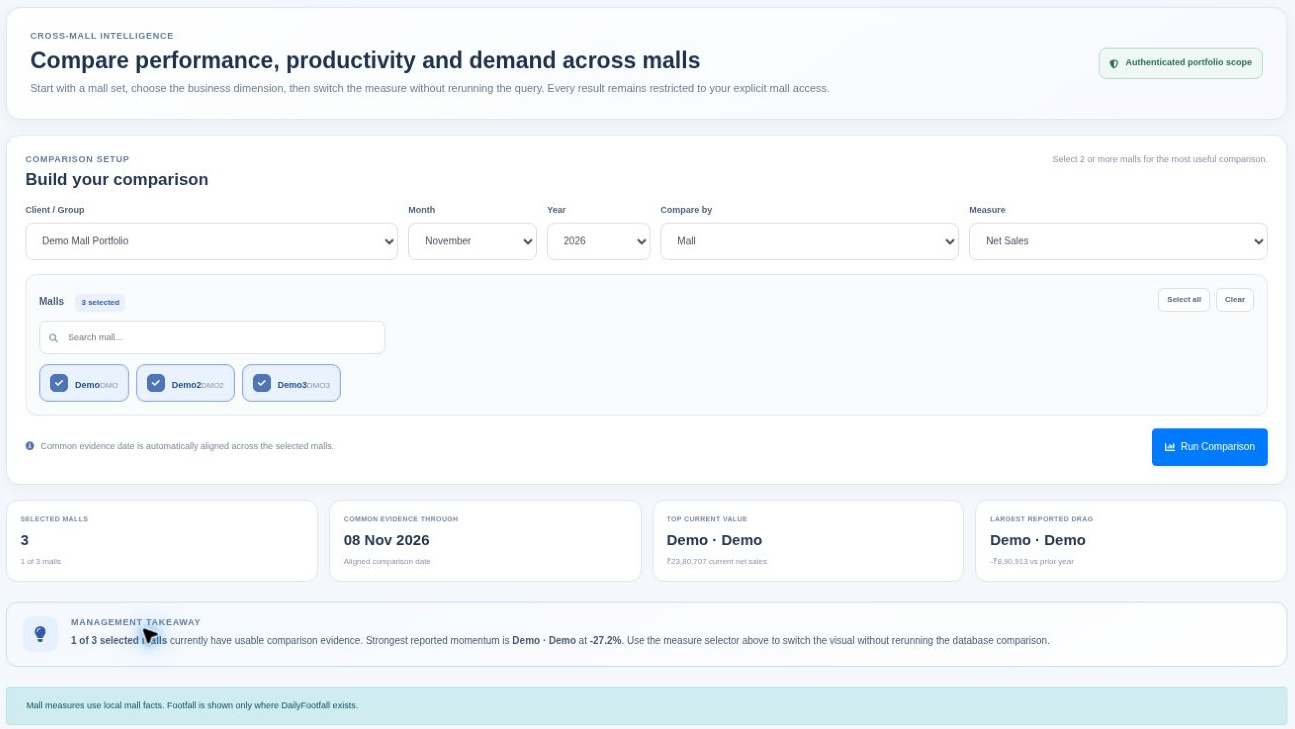
The comparison shows the selected period, participating properties and common evidence date. One of the three selected demo malls has usable comparison evidence.
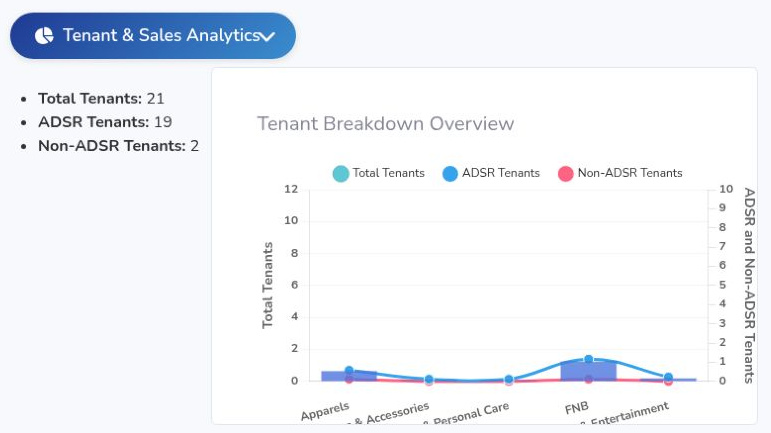
The mall dashboard breaks out tenants covered by ADSR. This demo selection lists 21 tenants, including 19 ADSR tenants and two outside ADSR.
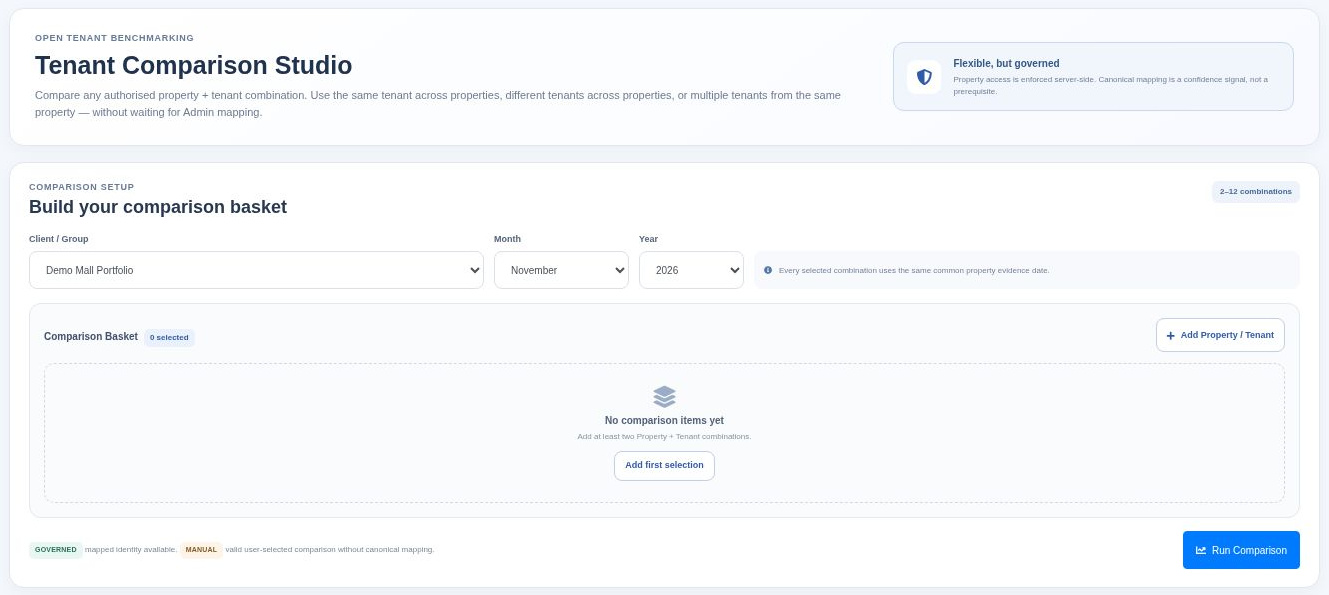
Choose a property and tenant for each side of a comparison. The empty setup screen shows where the operator builds the basket and chooses the reporting month.
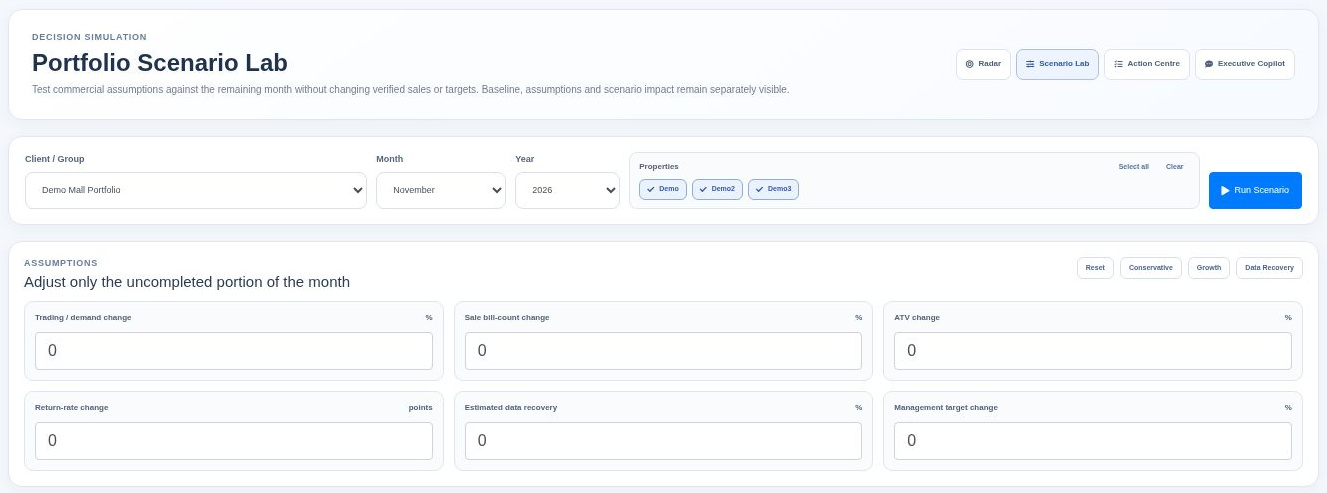
Set assumptions for the remainder of the month. The demo exposes separate inputs for bill count, average transaction value, return rate and other planning assumptions.
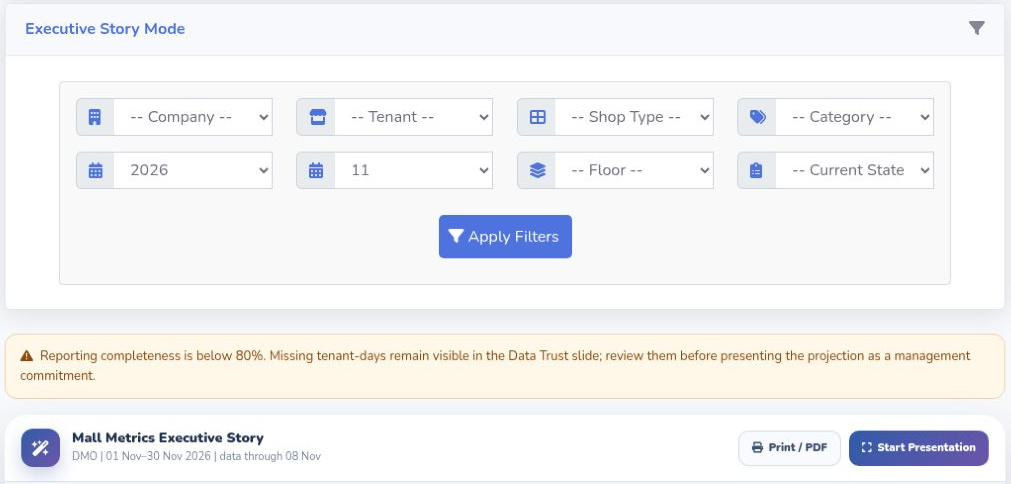
Read the reporting-completeness warning before sharing a management presentation. The visible controls offer a presentation view and a print or PDF action.
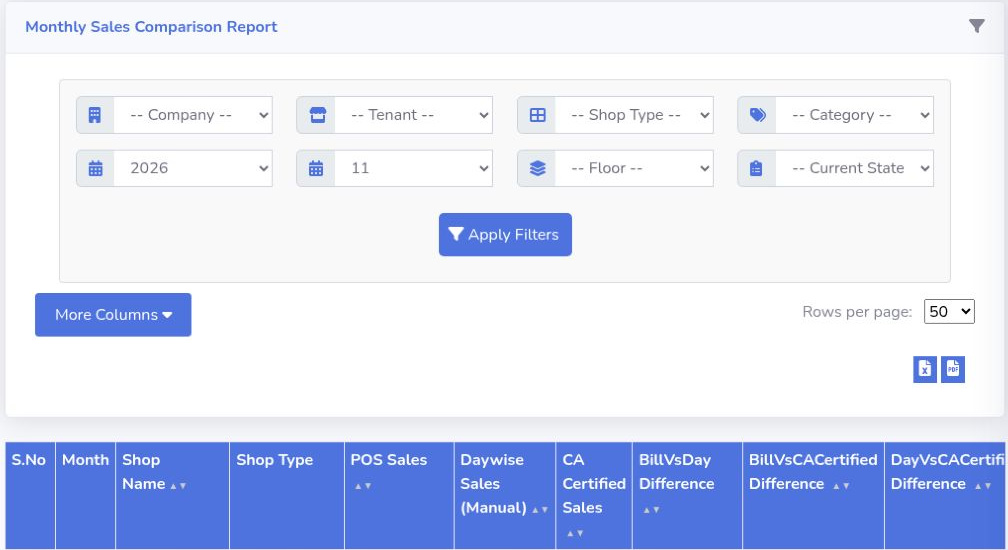
Read the three monthly sales sources side by side: POS sales, daily manual submissions and CA-certified sales. The report exposes a separate difference for each pair.
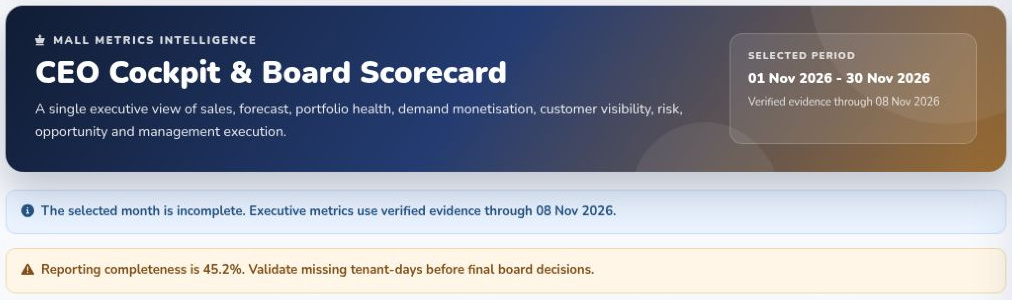
Before a board review, the cockpit shows which days have verified evidence and how much tenant-day reporting is complete. The selected demo period is still open.
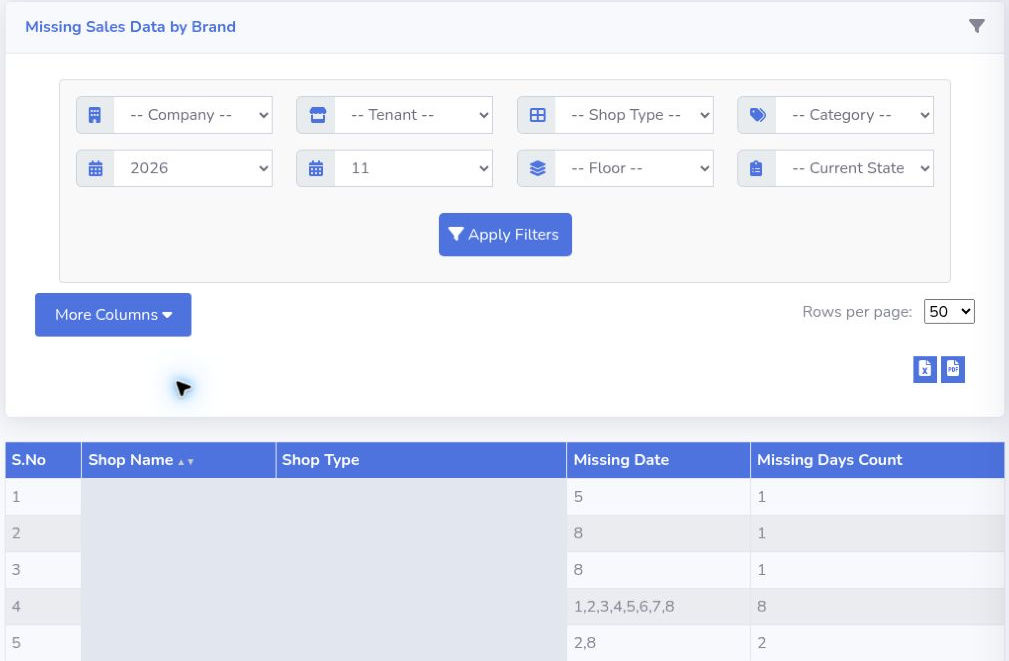
Use the missing dates and day counts to direct follow-up. Five anonymised demo rows show how a single absent day and a run of eight days appear in the report.
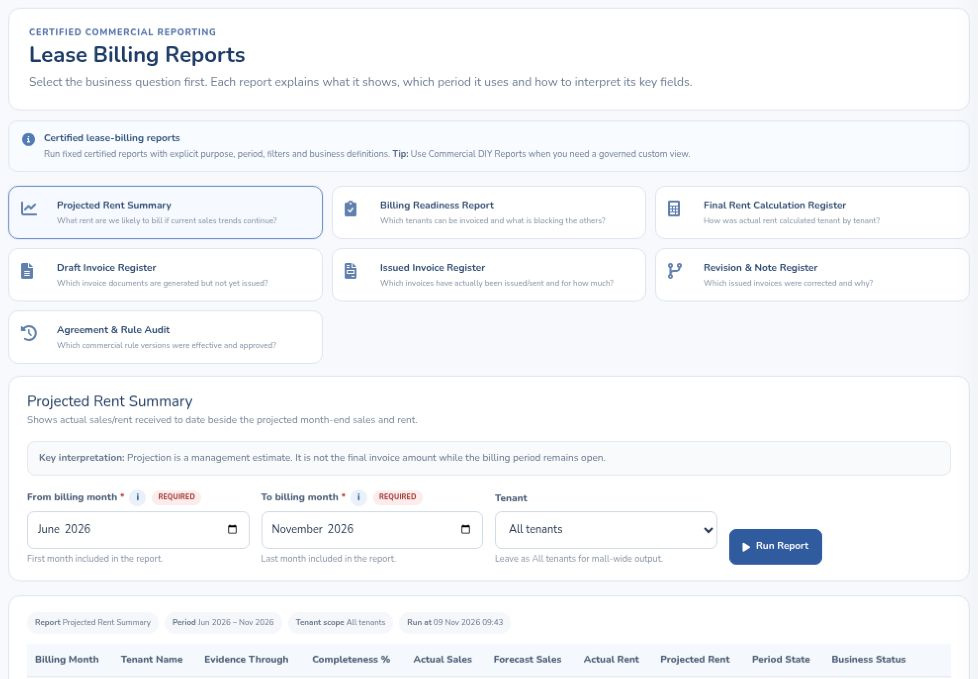
Choose among projected rent, billing readiness, final rent calculations, draft and issued invoices, revisions, and agreement-rule history. The selected report explains how to interpret a projection while the billing period remains open.
See how tenant submissions become a finance review and a management brief.