 Mall Metrics
Portfolio & tenants
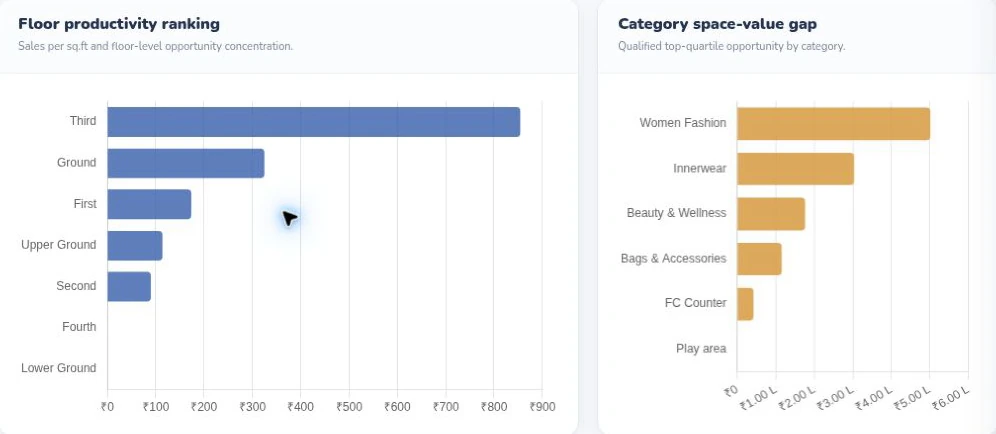
Floor productivity and category space value
Read rupees per square foot by floor next to each category’s estimated gap to its top-quartile benchmark. The two charts use different units.

A category can grow while a large tenant loses transactions. A small store can produce more sales per square foot than a neighbouring anchor. Mall Metrics gives leasing and asset teams several ways to explain those differences, from shop-level sales and bill counts to category movement and comparable-estate evidence.
Read rupees per square foot by floor next to each category’s estimated gap to its top-quartile benchmark. The two charts use different units.
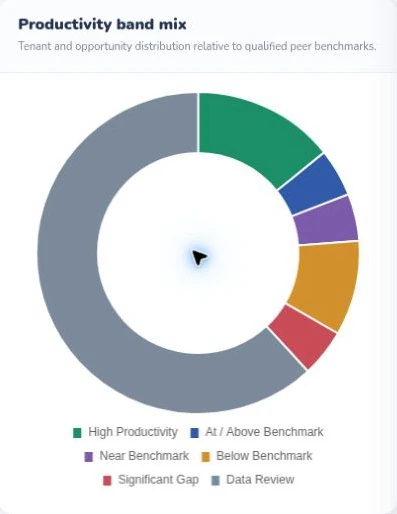
Compare tenant counts across productivity bands, including the data-review group. Use peer-qualified records when assessing a store’s productivity.
Tenant Monthly Sales brings together bill cuts, gross sales, returns, net sales, revenue per square foot and zero billing days. Revenue Efficiency adds a shop-level productivity view. Start with shops of a similar format, on a consistent area basis and across equivalent trading periods. A new store with a partial month needs its opening date alongside its numbers.
Suppose two stores in an illustrative US shopping center each sell US$200,000 in a month. One trades from 1,000 sq ft and the other from 2,000 sq ft. Their sales densities are US$200 and US$100 per sq ft respectively. A group comparing properties that record square metres can agree one area unit before comparing these figures. Before a renewal conversation, check whether their floor, area definition, merchandise and reported days make the comparison useful. Review bill counts and returns to understand whether sales changed through demand, basket value or adjustments.
Mall Intelligence includes category growth drivers, a tenant watchlist and tenant comparability evidence. Use the estate movement bridge to examine how changes to the trading estate affect management’s reading of growth. In a walkthrough, choose one tenant you would normally flag and trace the question from the overall movement down to its trading record.
Read the trading density guide · Book a tenant performance demo
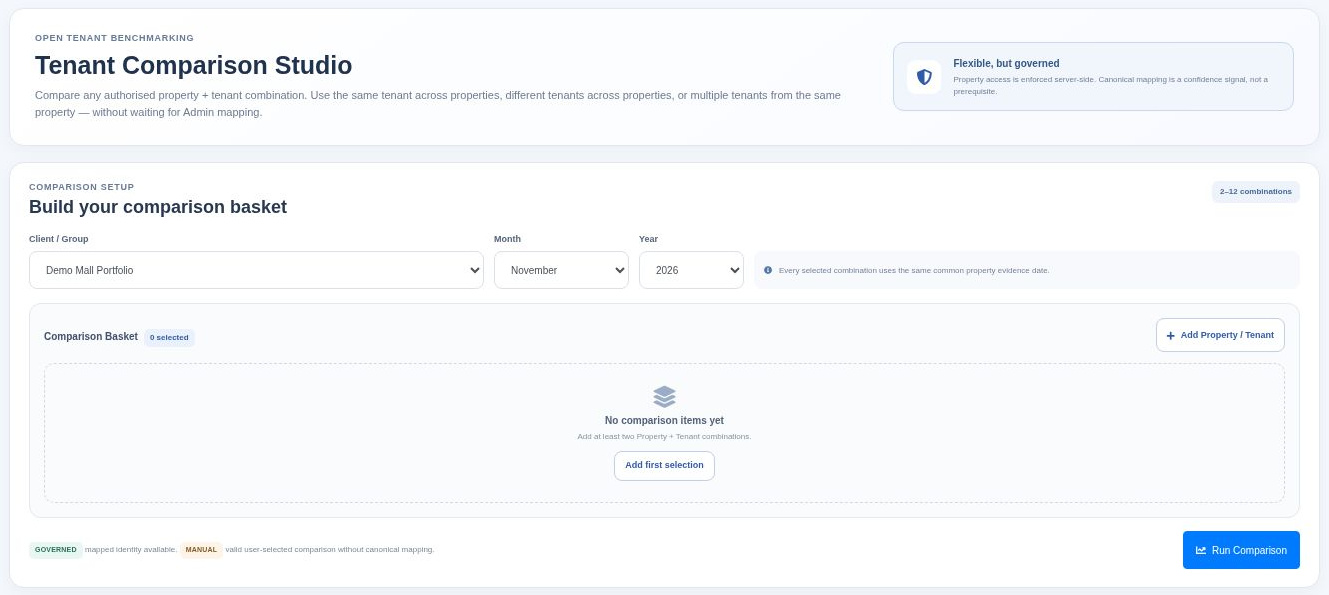
See how tenant submissions become a finance review and a management brief.