 Mall Metrics
Trading analytics
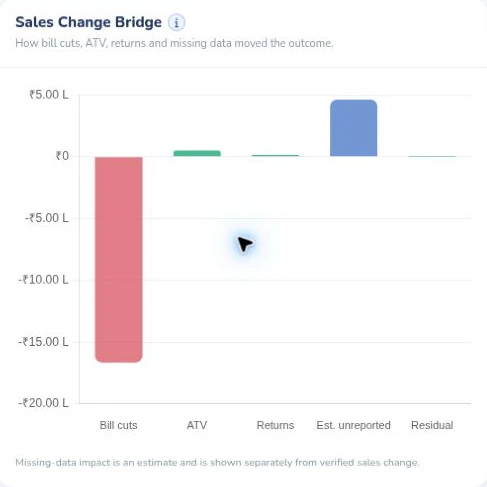
Sales change bridge
Trace the change in trading through bill count, average transaction value, returns, estimated unreported sales and the residual. The missing-data contribution is an estimate.

Ask which tenants drove a decline, which numbers need checking and what a different finish to the month would look like. Start with the scope of the data and follow the answer back to a report.
Explore the exampleTrace the change in trading through bill count, average transaction value, returns, estimated unreported sales and the residual. The missing-data contribution is an estimate.
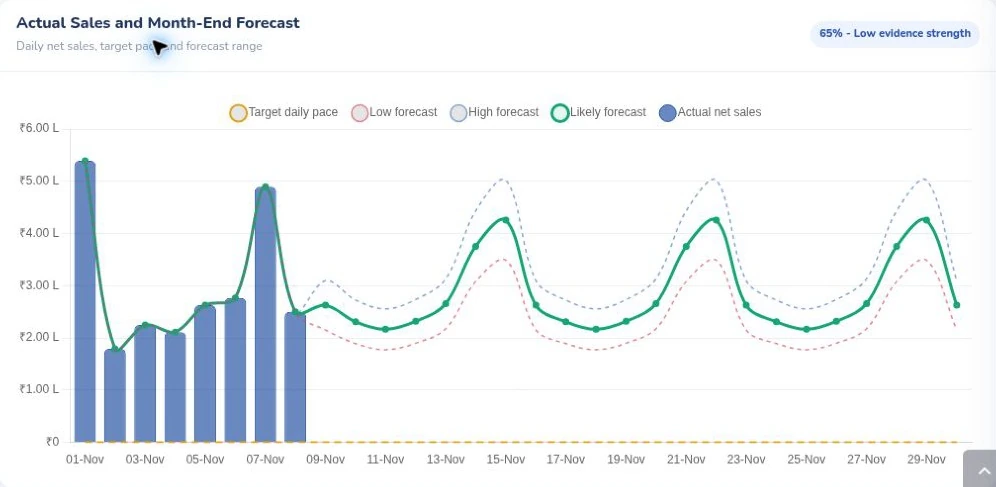
The bars show reported daily net sales through 8 November. The lines extend the likely, low and high daily forecasts to month-end. The evidence rating travels with the projection.
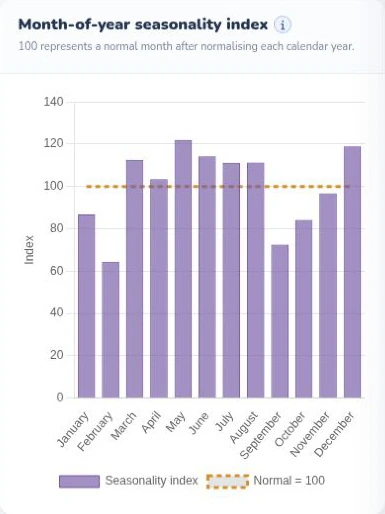
Compare each calendar month with the average month. The dotted line at 100 marks the baseline and makes seasonal peaks and troughs easier to read.
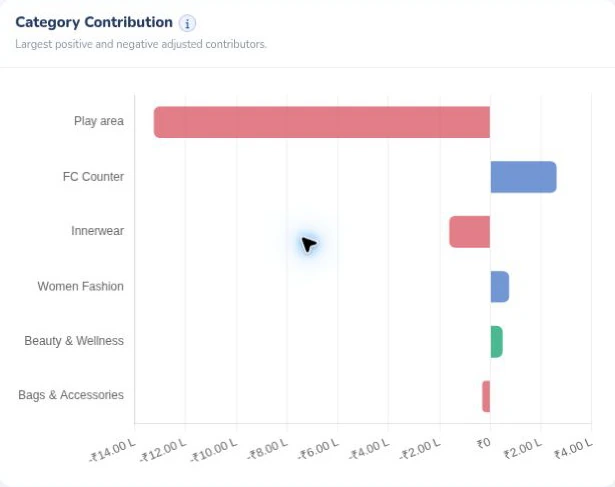
See which categories contributed positively or negatively to the adjusted change. The bars show signed contributions so a drag remains visible beside a gain.
Choose a question to inspect a worked example. Each answer shows the calculation and a report to open. The figures are illustrative.
At the 10:00 cut-off, 116 of 120 expected stores had submitted. Three of the 116 confirmed zero sales. Tenant relations can follow up with the four outstanding stores.
The 116 reporting stores traded $511,000, up from $500,000 for those same stores in the comparison period. The prior total for all 120 was $525,000. Including the four absent stores in the prior base makes growth appear negative.
One tenant’s monthly POS total is $310,000. Its daily declarations and its certified statement both total $307,600. Finance can start with POS adjustments and returns for that period. The figures alone do not identify the cause.
Use the sales change bridge to inspect drivers, drags and the effect of incomplete data. A category manager can then check the stores behind the movement.
Start with the tenant attention list. Compare a flagged store with its peers and review return pressure or sales per unit of space before deciding on a follow-up.
Compare historical forecast checkpoints with actual closes. Look at error, bias and evidence coverage before using a current projection in a management discussion.
Change bill count, average transaction value or returns for the remaining days. Review a hypothetical close alongside actuals through the cut-off.
The signed-in Ask Mall Metrics and Executive Copilot workspaces let operators pose questions in the selected property context. A useful management answer identifies the period, sales definition and tenant set behind the claim.
A scenario depends on assumptions. An unusual refund pattern prompts an investigation. Finance reviews supporting records and lease terms before approving commercial action.
Explore the official Fundle ADSR workflowThe Scenario Lab exposes assumptions for bills, transaction value and returns. Operators can distinguish the inputs they choose from the sales already reported.
View the report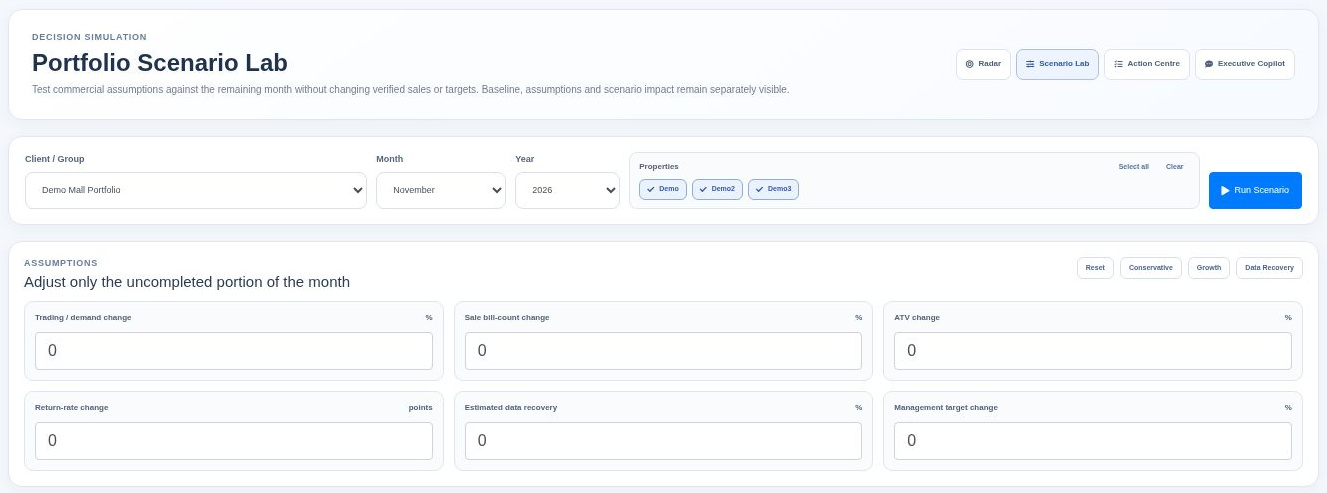
See how tenant submissions become a finance review and a management brief.