 Mall Metrics
Portfolio & tenants
Current versus prior-year portfolio sales
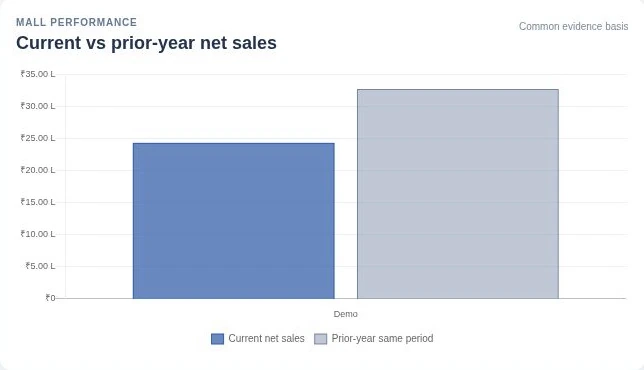
Read current and prior-year net sales for the one demo property with evidence in both periods. The comparison stops at the common evidence date.

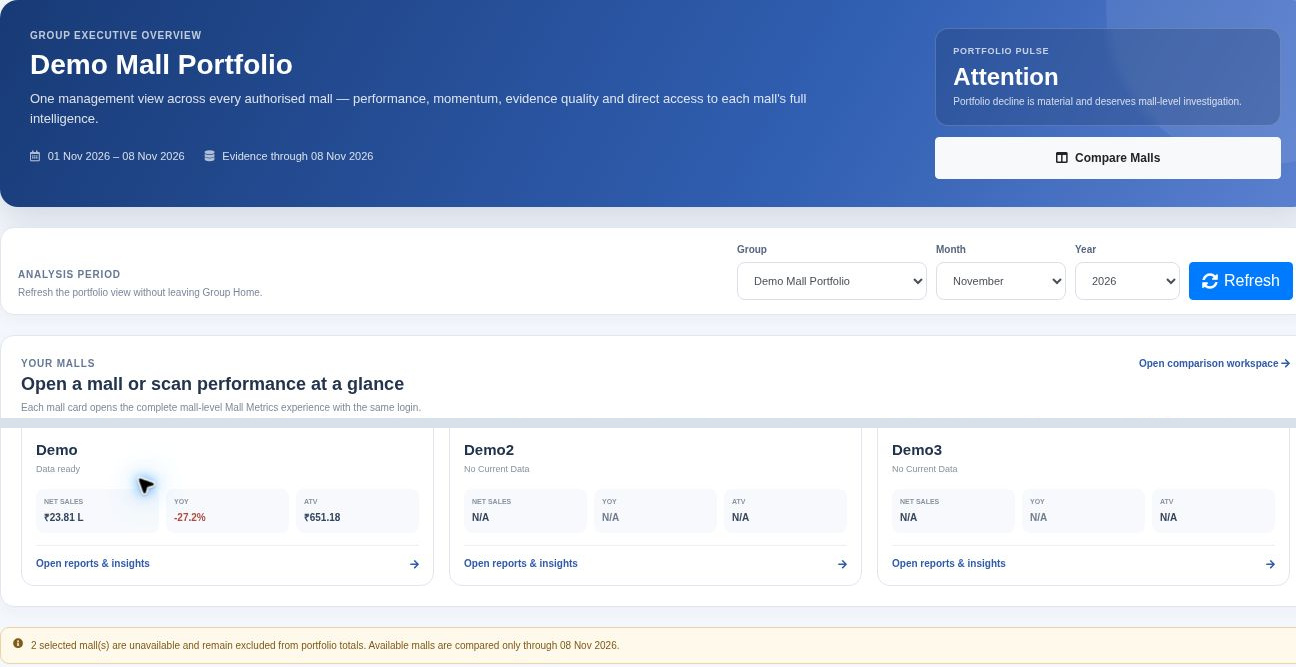
The weekly portfolio call should explain which properties drove the movement and how much evidence each supplied. Mall Metrics brings authorised malls into a group overview with current and prior sales, growth, bill count, average transaction value and a visible evidence-through date.
Read current and prior-year net sales for the one demo property with evidence in both periods. The comparison stops at the common evidence date.
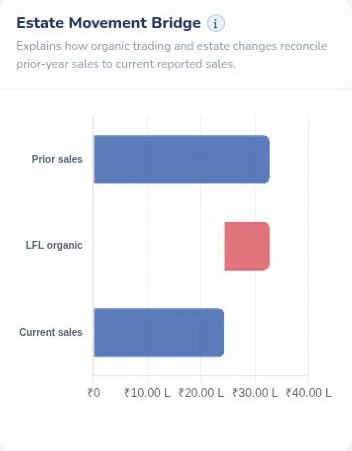
Read how the verified like-for-like movement connects prior-period sales to the current total in the demo’s estate bridge.
The group overview keeps malls with unavailable current-period evidence visible and excludes them from portfolio totals. It shows the number of comparable malls and the common cut-off used for the available properties. A missing mall can then be followed up by operations while management reviews the figures already received.
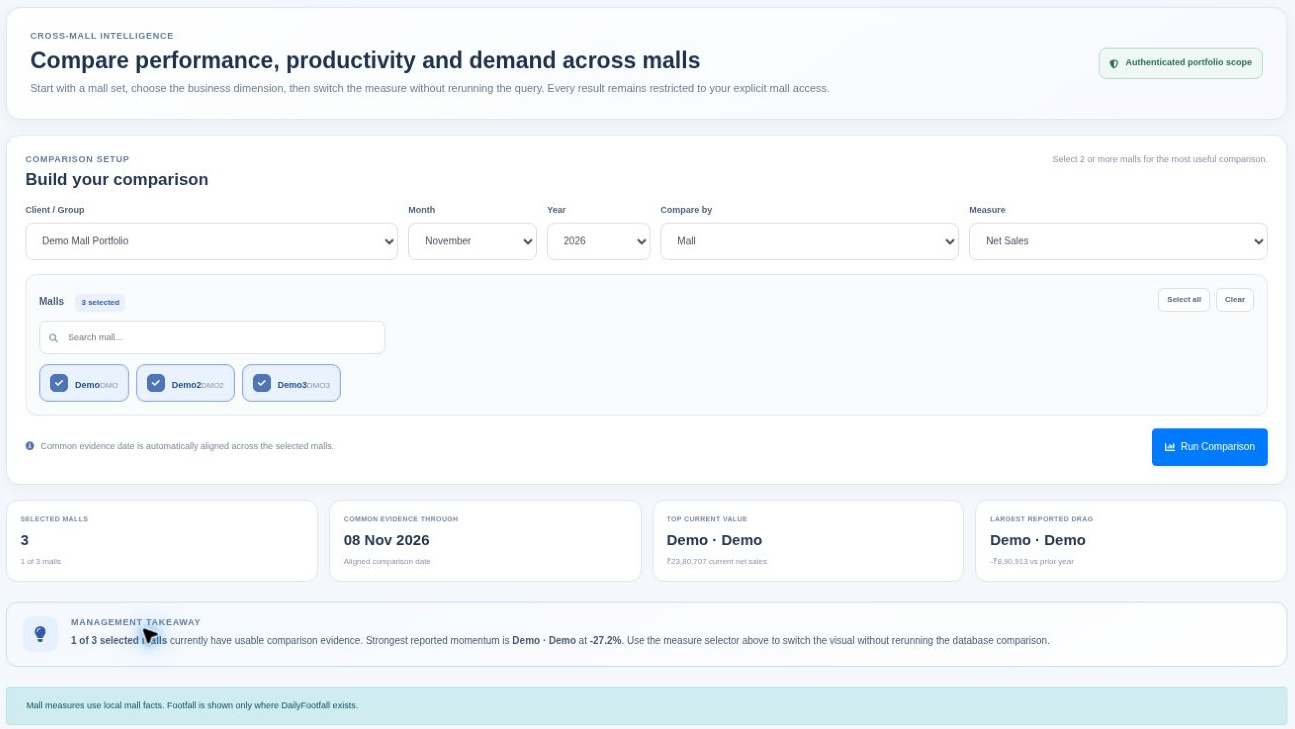
Compare Malls presents a ranked comparison with sales, sale bills, average transaction value, sales per square foot and, where inputs are available, footfall and revenue per visitor. Start with the same period across properties. For international portfolios, agree how to align local business dates, sales currencies and exchange rates before comparing amounts. A changing portfolio mix, a new anchor or a property that reports later than its peers can change the headline even when established stores trade steadily.
In an illustrative group with three properties selected and two reporting through Sunday, an executive can review the two contributing malls and ask for the third property’s latest submission. For the next question, open a mall’s own intelligence view to examine reported and like-for-like performance, category movement or tenant comparability. The Tenant Comparison Studio also provides a workspace for assembling a comparison basket.
Bring two malls with different trading and reporting patterns to the demonstration. We can walk through the common date, the contributing properties and the decisions a group head can reasonably draw from the result.
Read the like-for-like sales guide · Book a portfolio analytics demo
See how tenant submissions become a finance review and a management brief.